
alberto clemares expósito
From a fundamental perspective, the debt-ceiling will be a fiscal and psychological drag on the stock market until the political and economic self-harming ends, but for now the spending can continue thanks to the Treasury cash balance (TCB) and the “extraordinary measures” available to the Treasury.
In this piece, we are looking at the stock market from a strictly technical perspective.
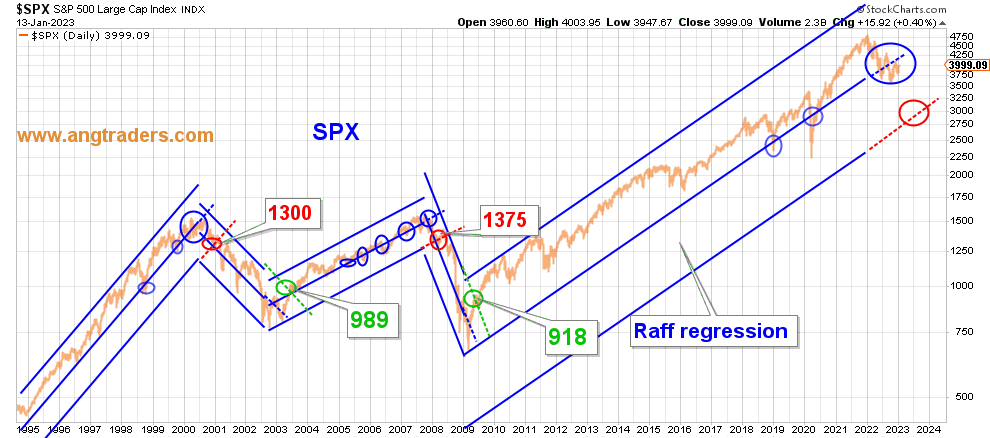
In the very long term (years and decades), the SPX continues to ride the mid-line of the Raff regression higher like it has done many times in the past 30-years without falling into a “full-frontal” bear market (blue-ovals below). The common belief that a 20% pullback defines a bear market, is arbitrary and not backed up technically; a break below the lower Raff regression line (red-ovals below) is required for technical confirmation of a bear market.
30-years (ANG Traders, StockCharts)
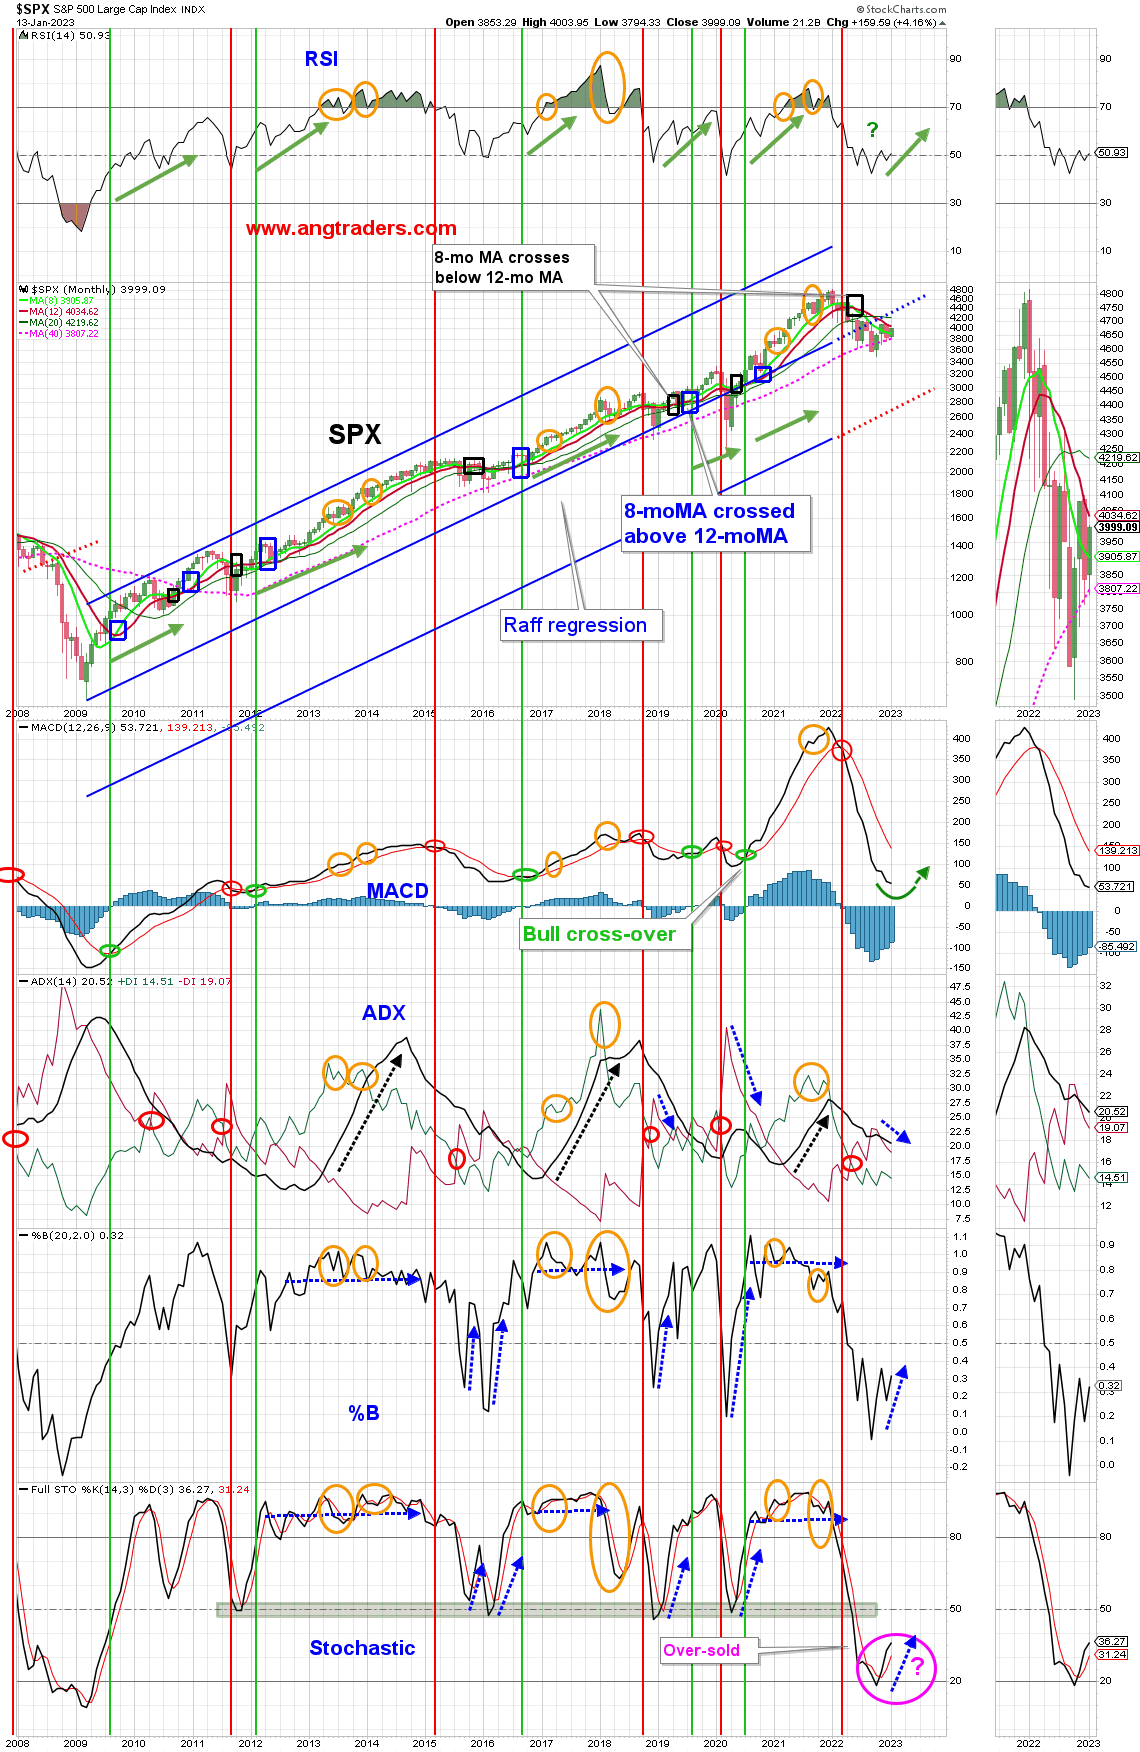
A closer view shows the SPX is above both the 40 and 8-month MA, and the technicals are recovering from oversold levels.
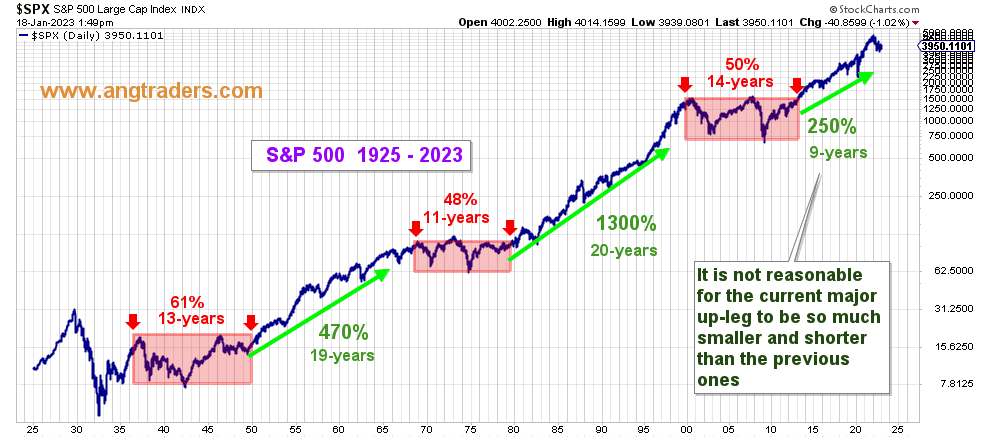
Over the last 100-years, the stock market displays a “step-like” pattern of trading-range periods (steps, highlighted in purple) that last ~12-years, punctuated by rallies (risers) that last ~20-years. Currently, we are nine years into one of these major rally periods, which suggests that we are only halfway through this major bull market (chart below):
Long Fractals (ANG Traders, StockCharts)
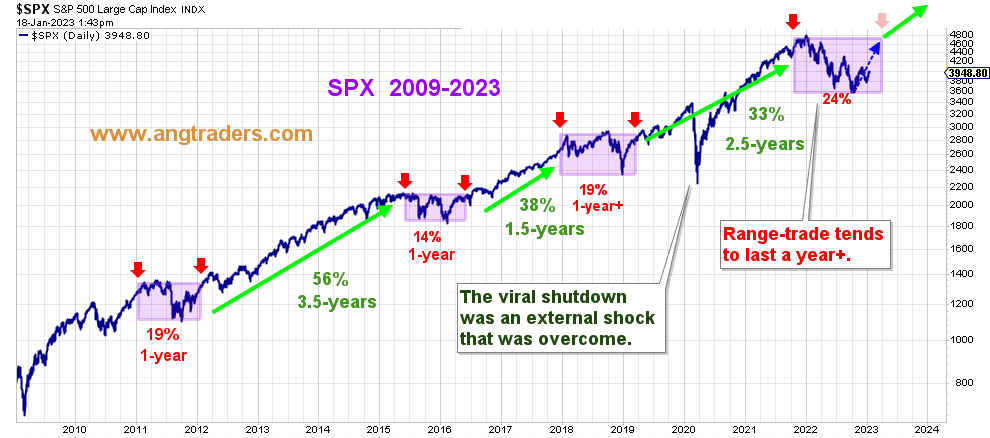
Closing in on the last 9-years, we can see that there is a fractal replication of the “step-like” pattern, where trading-range steps last ~1-year and intervening rallies last 2-3-years. According to this pattern, the SPX is climbing away from the bottom of the trading-range and should break out into new highs late in 2023 (chart below).
Close Fractals (ANG Traders, StockCharts)
Turning now to a shorter time-scale (days and weeks), the weekly-SPX has broken above the Raff upper-line and now faces resistance at the 50-week MA, 4038. We expect some hesitation before it breaks above this resistance (chart below).
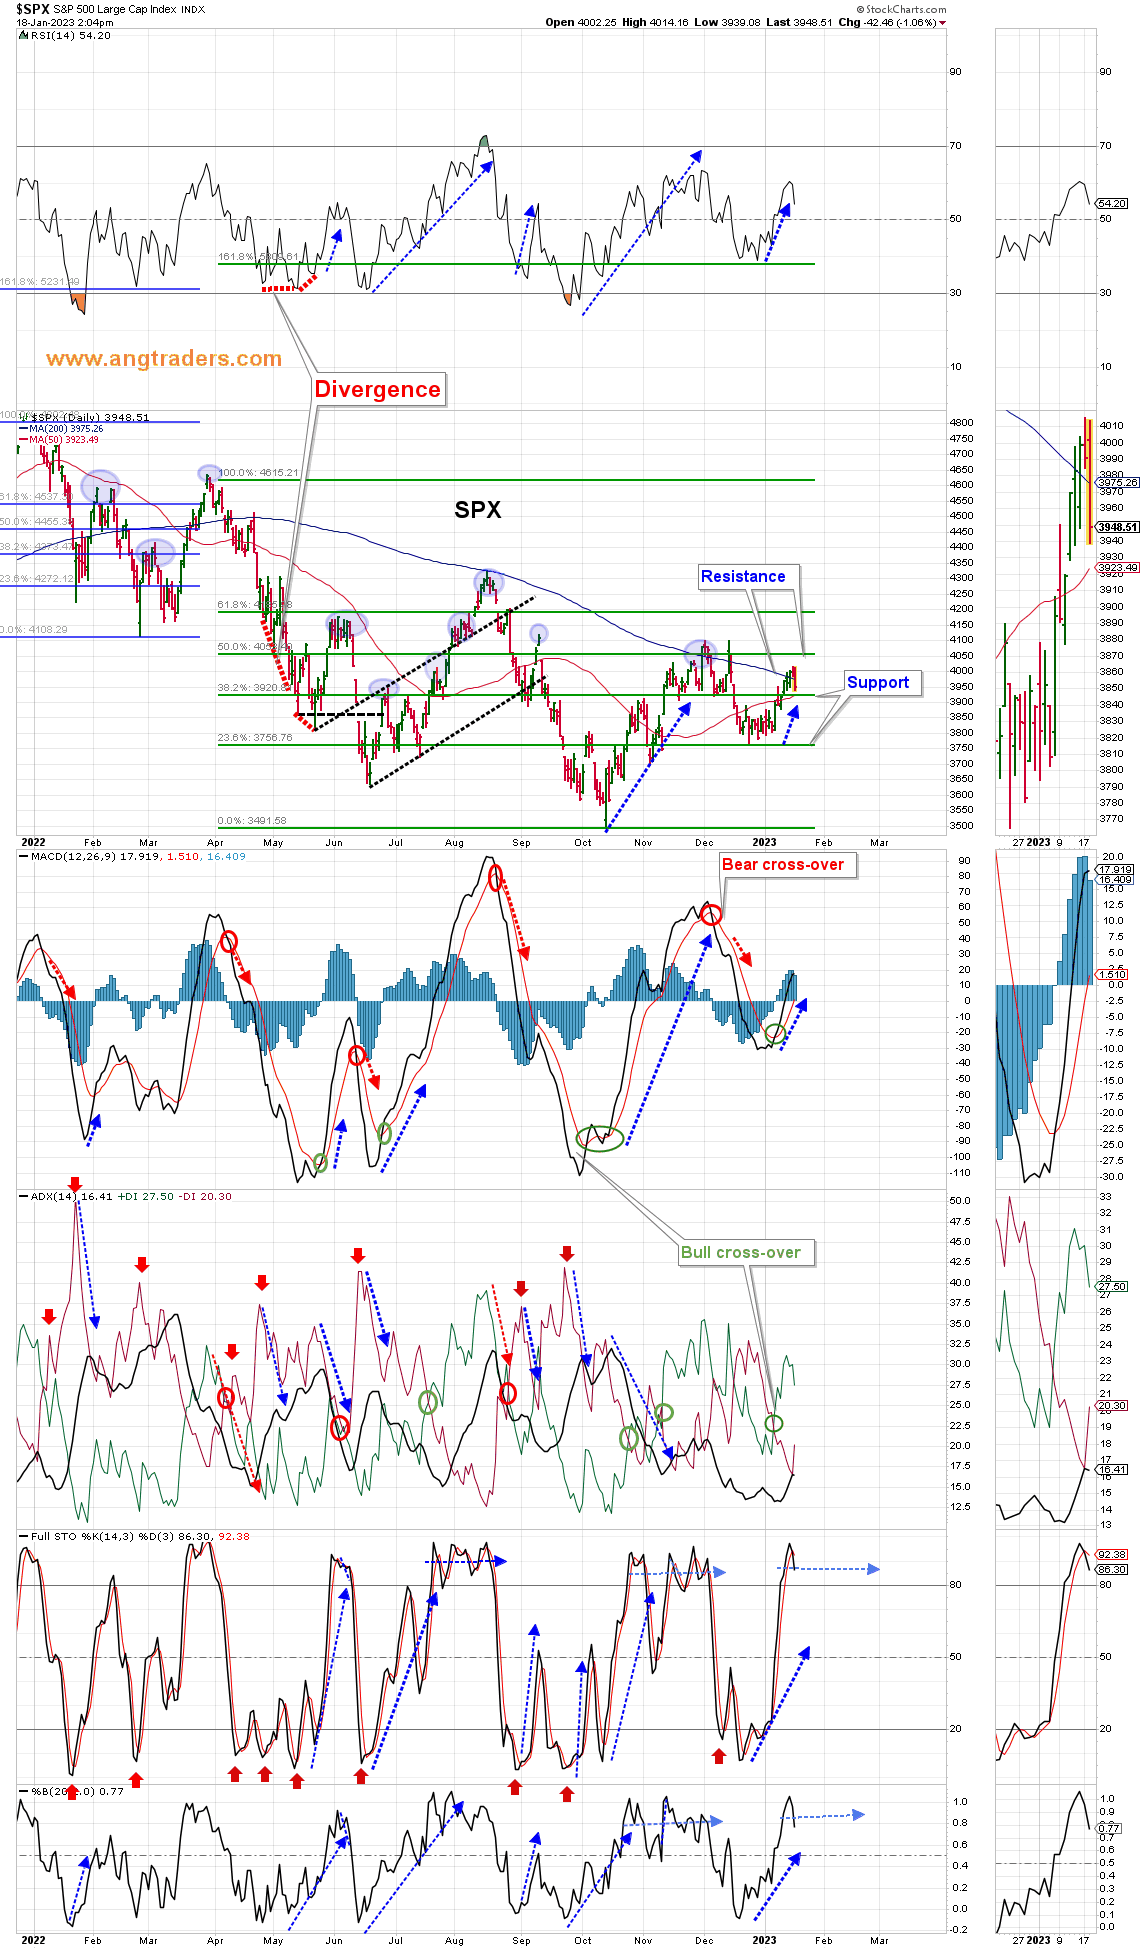
At the daily-scale, the SPX has been turned back by resistance at the 200-day MA, but there is dual support just below at 3920 (the 38% Fibonacci retrace and 50-day MA) and then again at 3757 (the 23.6% Fibonacci retrace). The other technicals are elevated, but they can stay that way for some time without causing problems for the SPX. Some neutral-to-weak movement in the stock market is expected for the next week or two (chart below).
SPX daily (ANG Traders, StockCharts)
The value:tech ratio is bullish (for the SPX), but the technicals have reached over-extended levels, which means we expect a number of days of SPX weakness (chart below).
Value:Tech Ratio (ANG Traders, StockCharts)
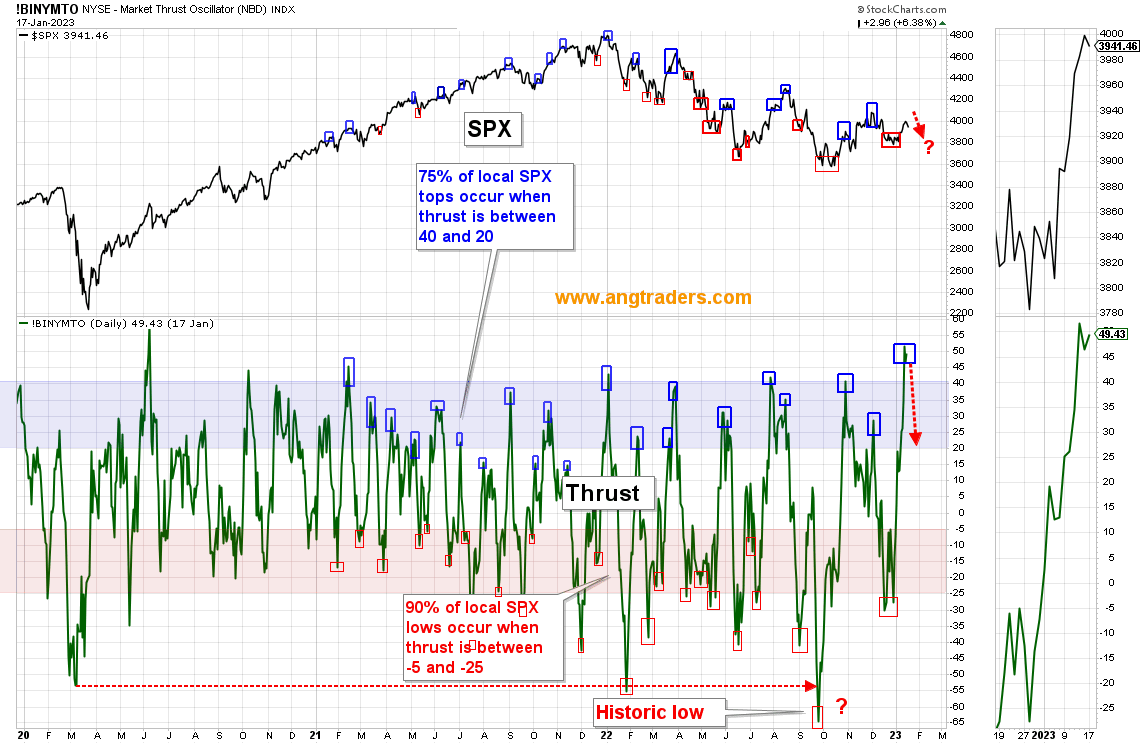
The thrust has overshot the topping zone, like it did in May 2020. This doesn’t mean that the SPX can’t go higher, but it does suggest a “breather” like we saw in June of 2020 before continuing to rally.
Thrust (ANG Traders, StockCharts)
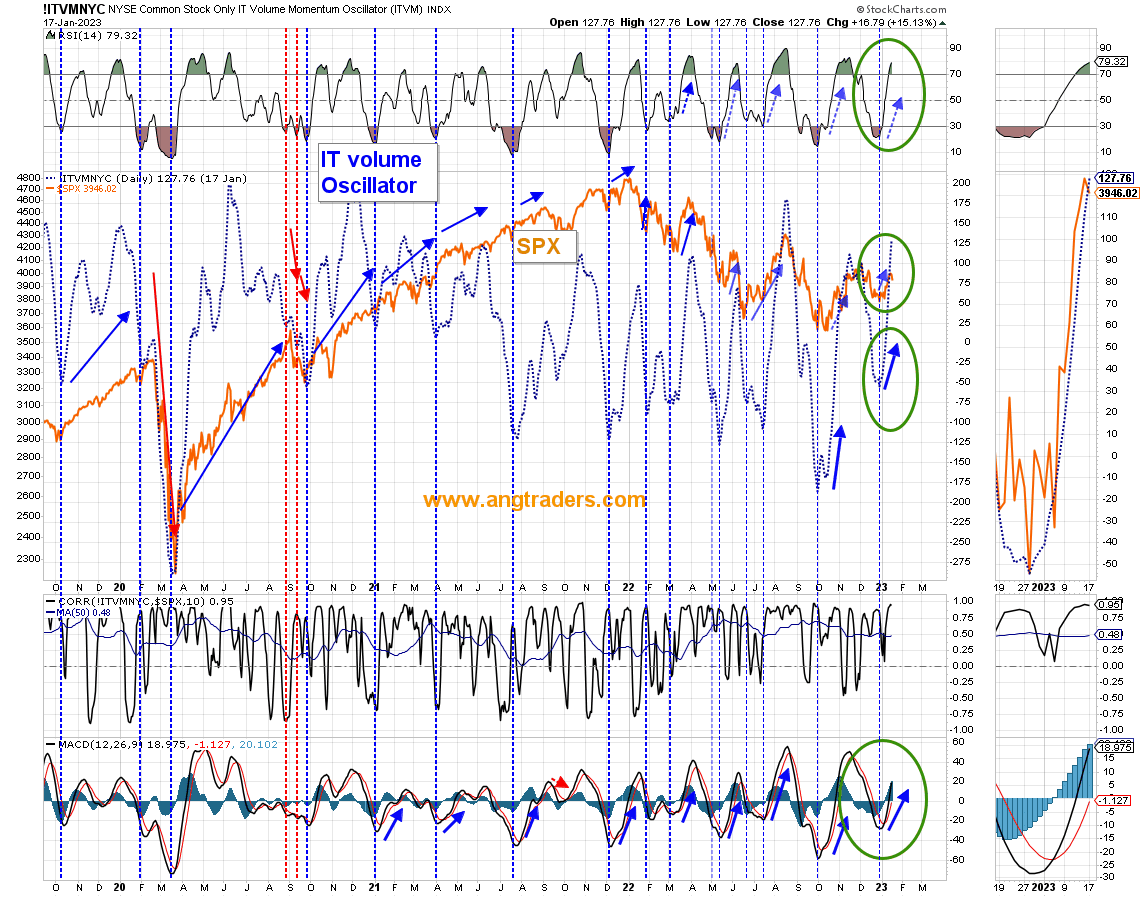
The IT volume oscillator RSI has crossed above 70 which means the chances of a pullback in the SPX have increased, although there is room for it to rise further (chart below).
IT Oscillator (ANG Traders, StockCharts)
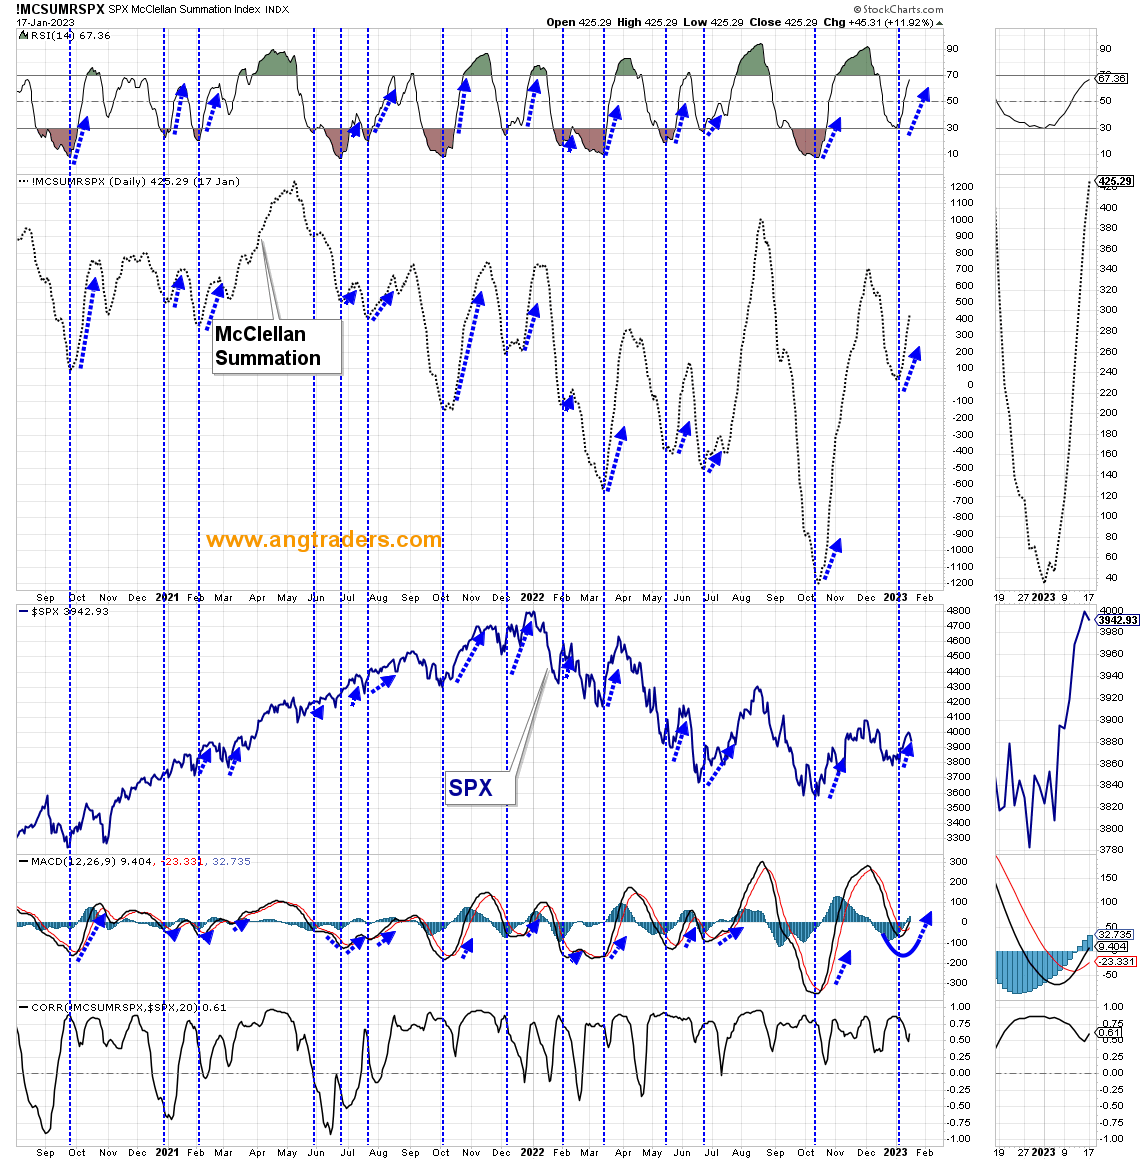
The McClellan summation RSI is approaching the over-bought level of 70. This means the SPX is close to a short-term pullback (chart below).
McClellan (ANG Traders, StockCharts)
In summary: The long-term primary trend remains bullish. The SPX is bouncing off of the bottom of the fractal trading-range and is likely to breakout into new highs before the end of the year. Over the next couple of weeks, the market is expected to weak (but not break down) and this should provide an opportunity to add long positions in broad -spectrum ETFs such as SPY, QQQ, and IWM.