
artpartner-images/The Image Bank via Getty Images
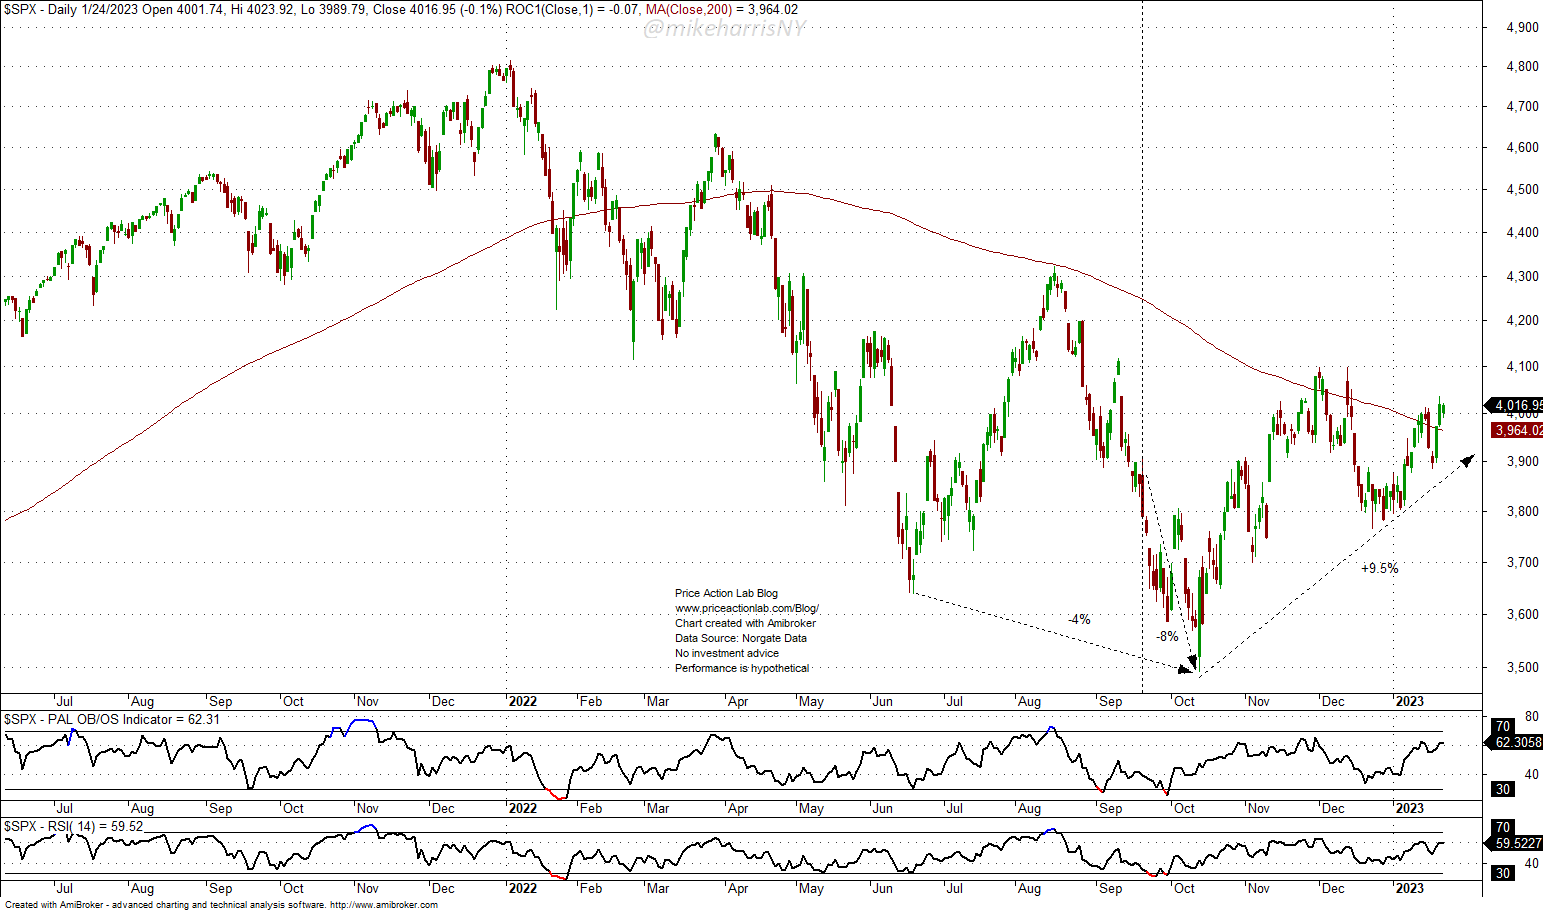
Since our article “7 Indicators Say We May Have Not Seen The Worst Yet In The Stock Market” published on SA on September 23, 2022, the S&P 500 (SPX) first fell 8% to make a new low at about 4% below the low of June 17, 2022, and then rebounded 9.5%, as shown in the chart below.
S&P 500 Daily Chart (Price Action Lab Blog – Norgate Data)
The vertical dotted line marks on the charts indicate when the quoted article was published on SA. It may be seen that the S&P 500 has been consolidating since May of last year inside a wide channel between 4,300 and 3,500. The index needs to break and stay above 4,300 for a confirmation of the end of the correction that started on the first day of last year, or break and stay below 3,500 for a confirmation of a bear market continuation. No one knows what will happen. Some traders focus on fundamentals, but the effectiveness of this type of analysis has diminished due to high noise and a change in market behavior. Technicals do not offer a crystal ball either, but the potential of providing hints about market direction is higher. One problem with fundamentals during uncertain markets is the large lags in reporting indicator values. This is not a problem with technicals, but confirmation bias can be an issue and affects analysts.
We will look again at the 7 indicators of the SA article mentioned, updated with the latest data. Vertical dotted lines on the charts are set on September 21, 2022, when the article was submitted for publication.
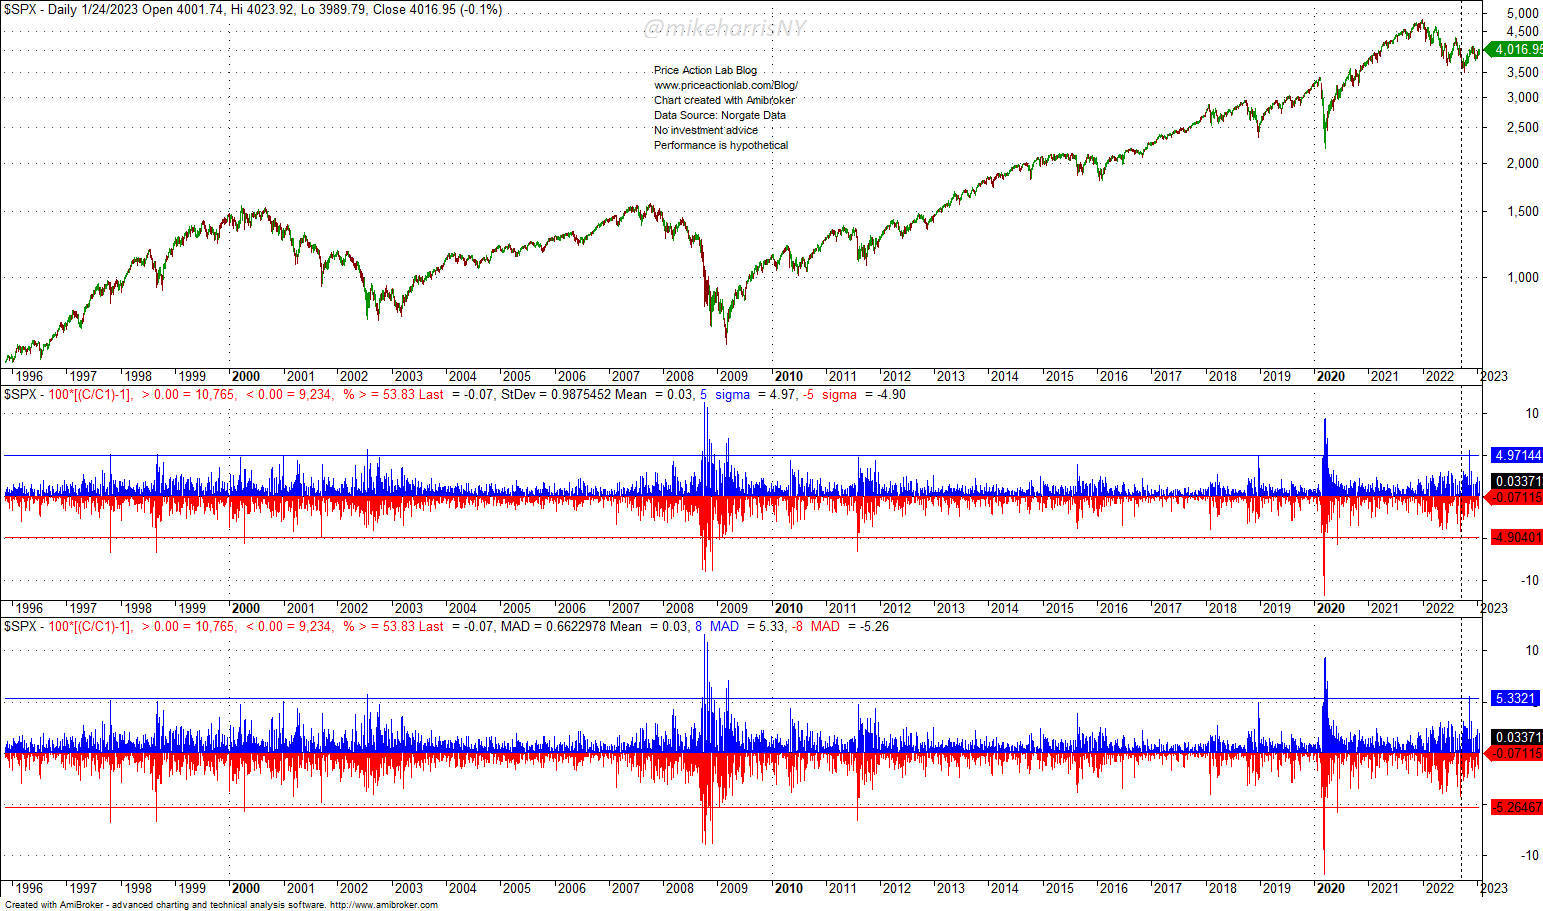
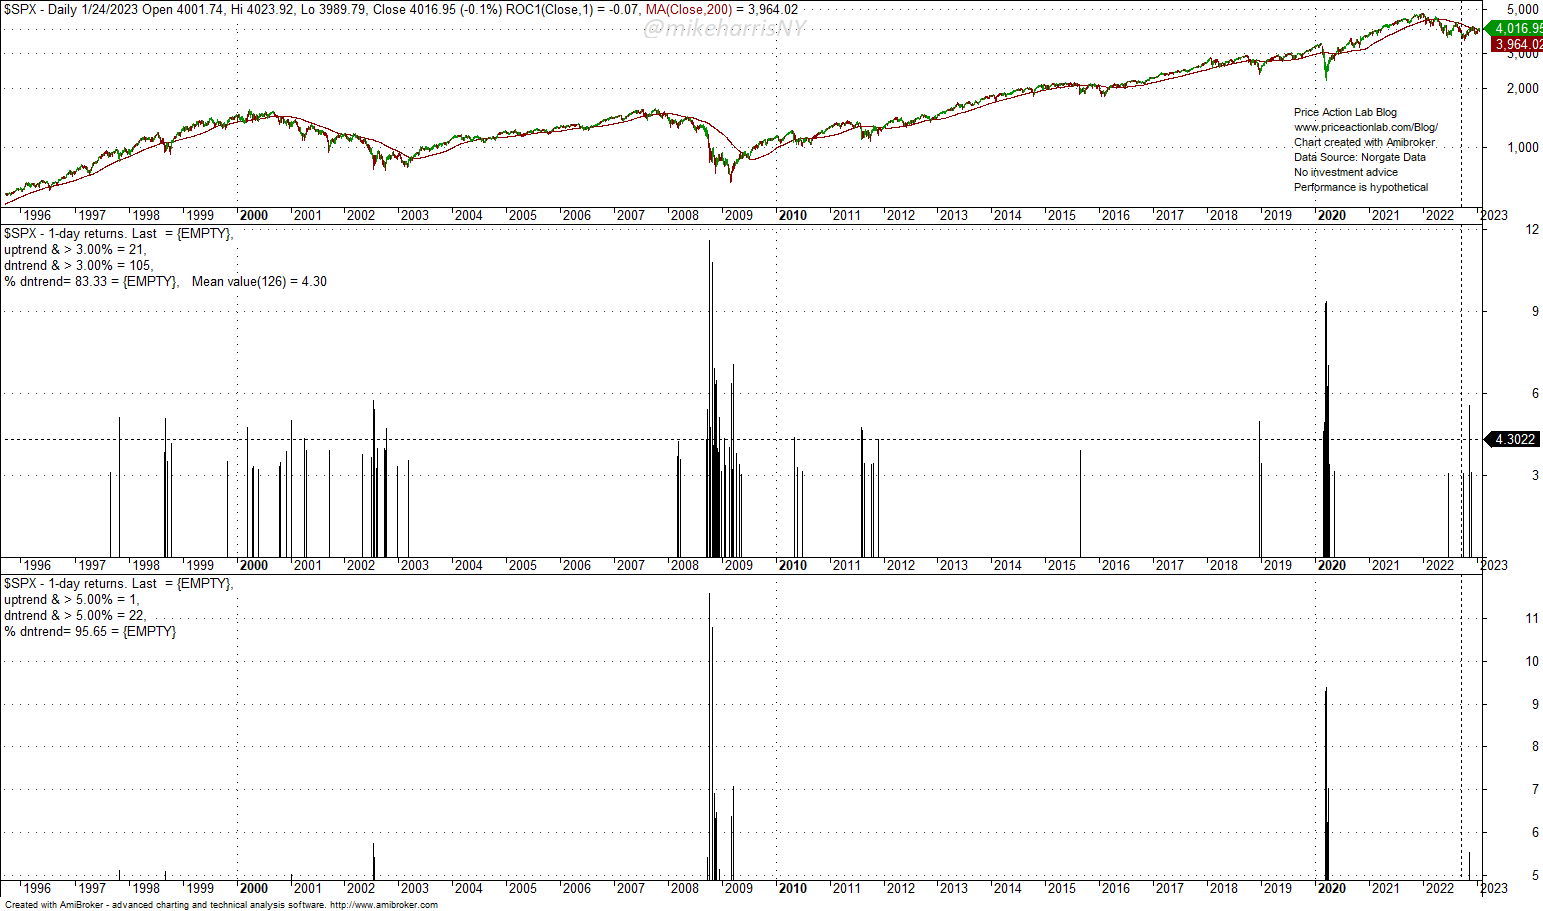
The S&P 500 (SPX) daily returns chart is shown below.
S&P 500 Daily Chart with Daily Return, Standard Deviation and Mean Absolute Deviation Bands (Price Action Lab Blog – Norgate Data)
The top daily returns chart shows the +/- 5 standard deviation bands. The bottom daily returns chart (identical to the first) shows the +/- 8 mean absolute deviation bands.
In the first article, we wrote:
During the past two major bear markets, and even during the 2020 pandemic crash and the 2011 correction, daily returns exceeded the thresholds defined by the bands. However, this year, all action has been confined between those thresholds. Source.
The volatility increased after September 21, 2022, as indicated by the vertical mark on the chart. However, past high volatility levels in the daily timeframe were not reached. This is not necessarily a signal that the correction will continue, as it could be the result of a regime change with compressed volatility.
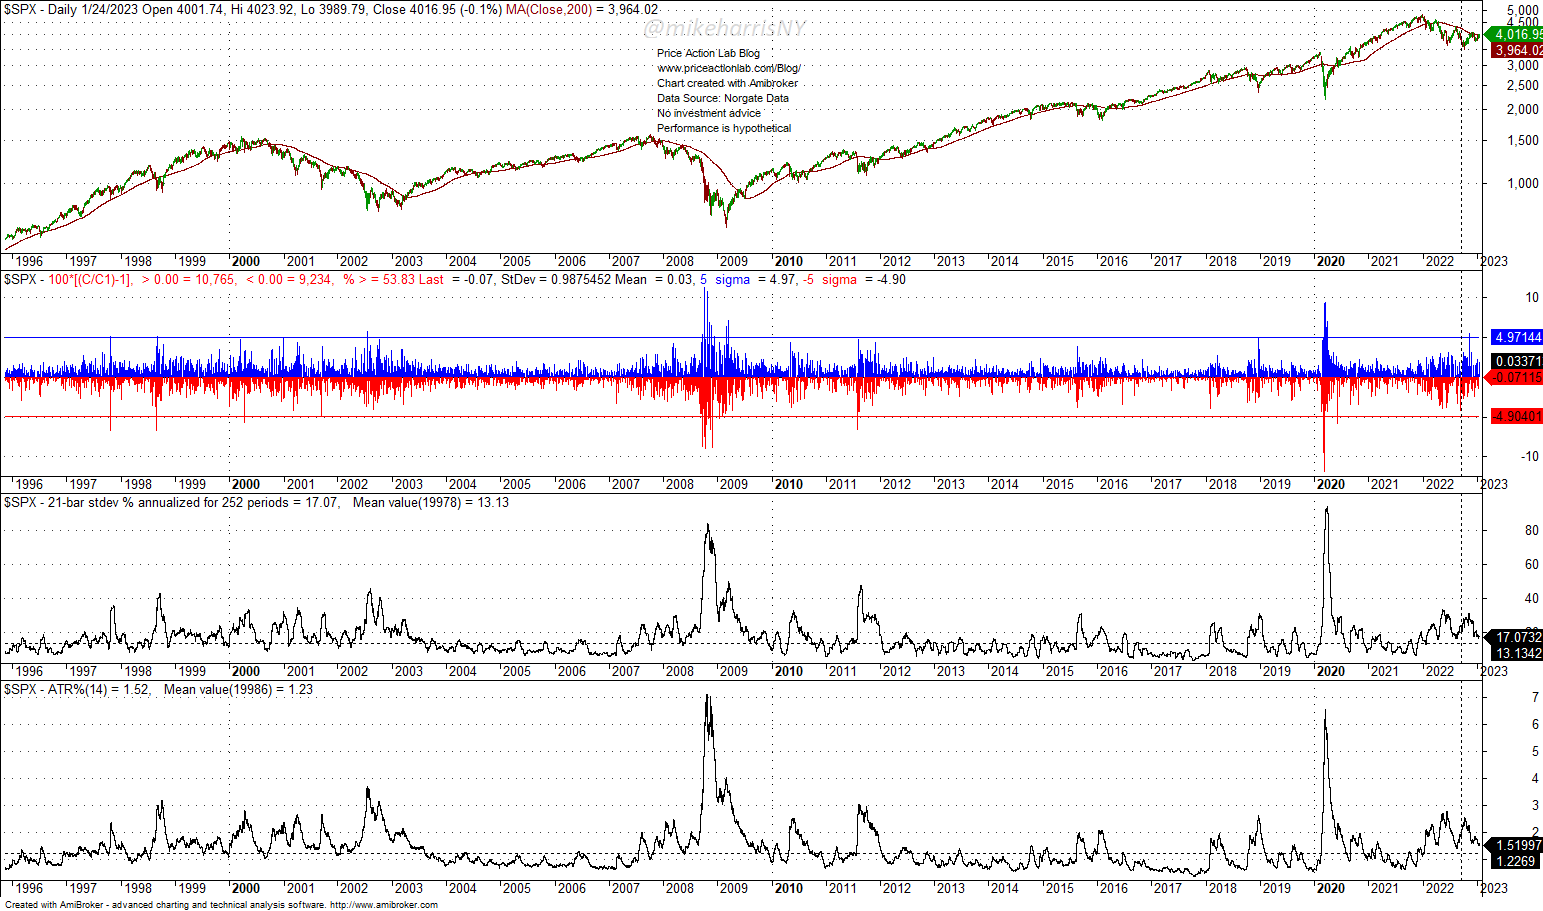
The lack of volatility extremes can also be seen in the chart below.
S&P 500 Daly Chart with 21-day Annualized Volatility and 14-Day ATR % (Price Action Lab Blog – Norgate Data)
The 21-day annualized volatility and the 14-day ATR as a percentage of the closing price have stayed much below the levels reached during previous bear markets and large corrections.
If the stock market is on a recovery path, then there is a significant regime change of low volatility. This may be caused by a change in market dynamics due to elevated options activity. However, this is a hypothesis, and it is hard to prove it.
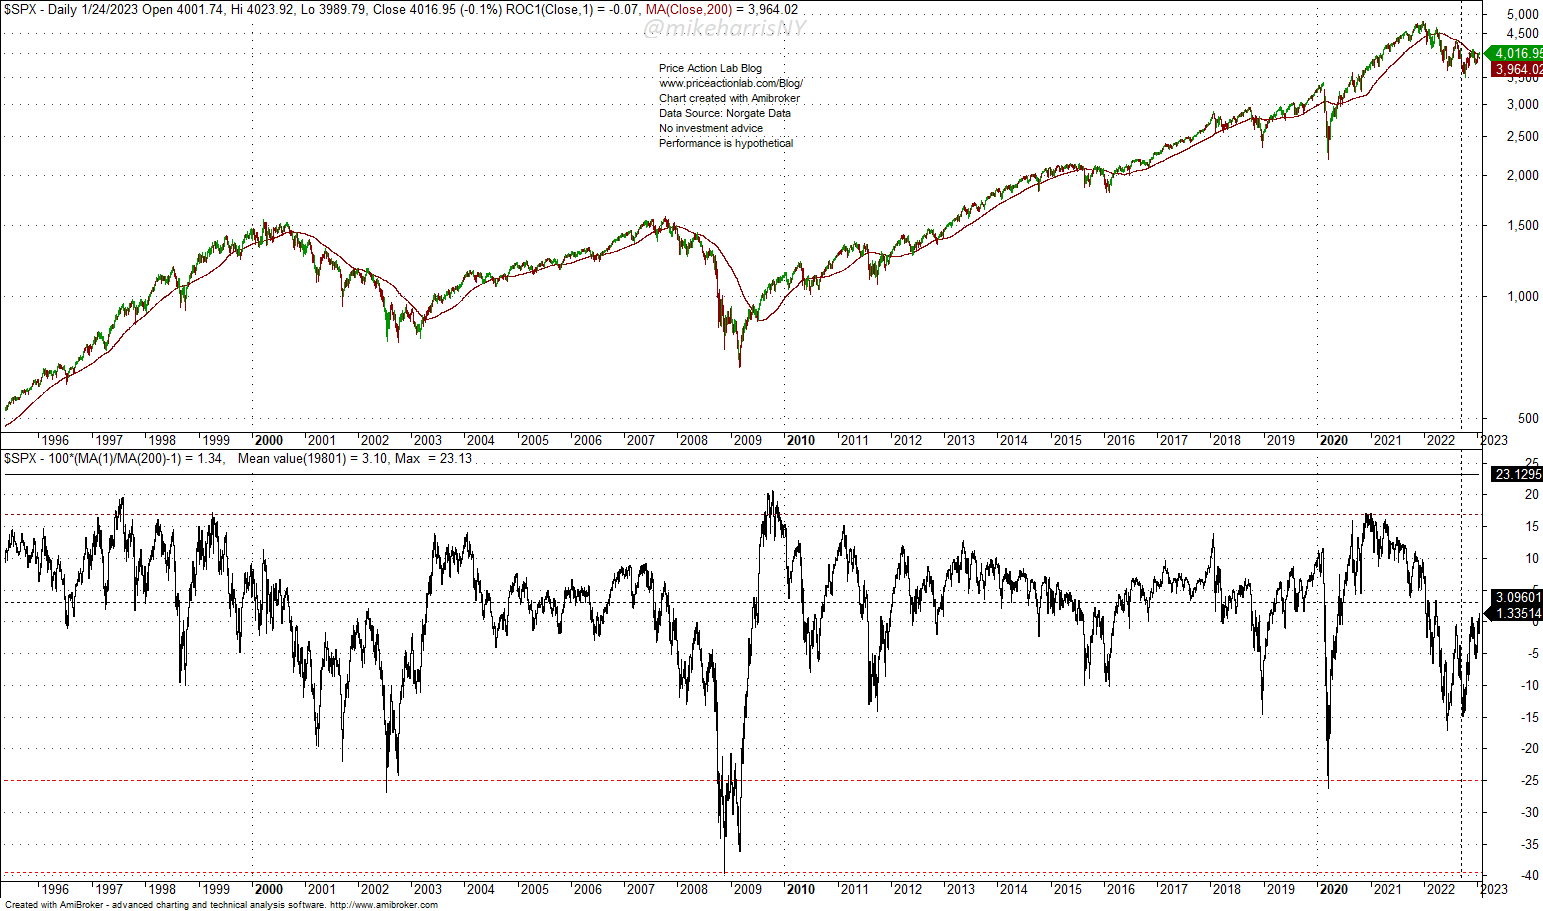
The indicator of the distance of price from the 200-day moving average in percentage terms also provides a similar perspective, as in the original quoted article of September 23, 2022.
Daily S&P 500 Chart with Distance From 200-Day Moving Average (Price Action Lab Blog – Norgate Data)
In the first article, we wrote:
In both previous bear markets and during the 2020 pandemic crash, the distance from the 200-day moving average fell below -25% (red dotted line)… The current value could be the bottom, as in 2011, 2015, 2016, and 2018, or there is substantial downside potential. Source.
There was not a significant change in the distance of price from the 200-day moving average after the original article. No extreme levels were realized to indicate a market bottoming action. However, we should emphasize again that extreme levels are not necessary for a bottom but may provide a higher probability signal.
The lack of strong relief rallies surprised many traders last year. The updated chart is shown below.
S&P 500 Daily Chart With Large Daily Returns (Price Action Lab Blog – Norgate Data)
The top indicator chart shows daily returns greater than +3%. The bottom chart shows daily returns greater than +5%. In the last article, we wrote:
This peculiar lack of relief rallies may be an indication of a regime change or that the real correction has not started yet. Source.
Since the last article, there have been three daily returns larger than 3% and one larger than 5%. Still, the number of large returns is much lower than what we have seen in past bottoms of large corrections and bear markets.
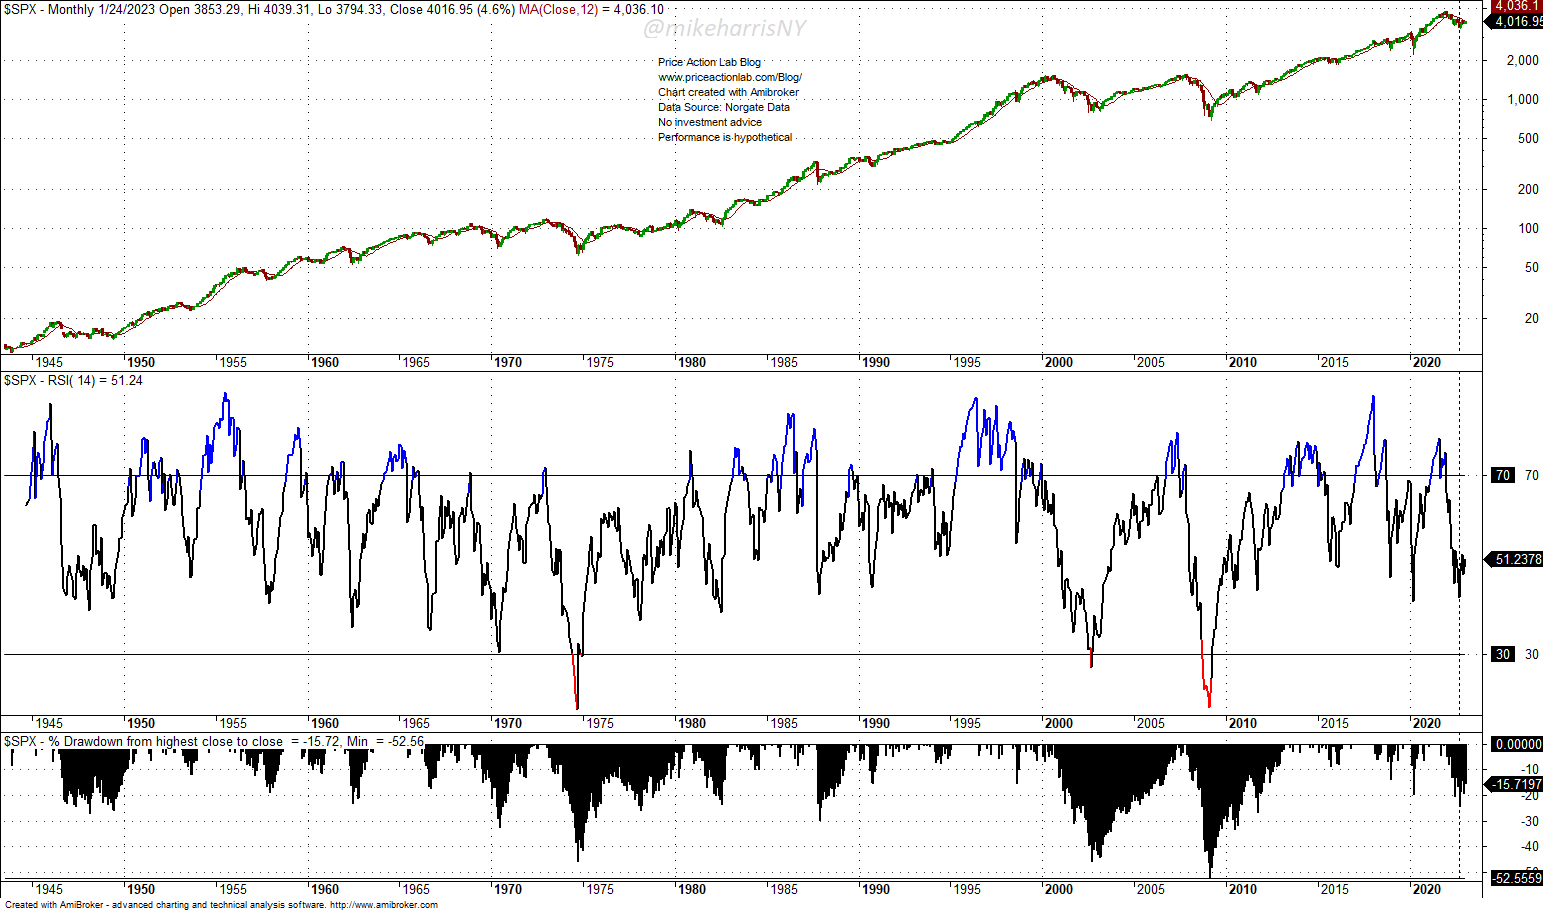
The 12-month Relative Strength Index has not changed much since the last article and does not indicate any oversold conditions have occurred.
Monthly S&P 500 Chart with 12-Month RSI (Price Action Lab Blog – Norgate Data)
In 1974, 2002, and 2008, the 12-month RSI reached oversold territory (below 30) and signaled a bottom. In the case of large corrections, in 2011, 2018, and 2020, this indicator did not signal a bottom.
This indicator is useful to monitor but it can provide false signals. However, it is a fact that since the last article, this indicator has changed little.
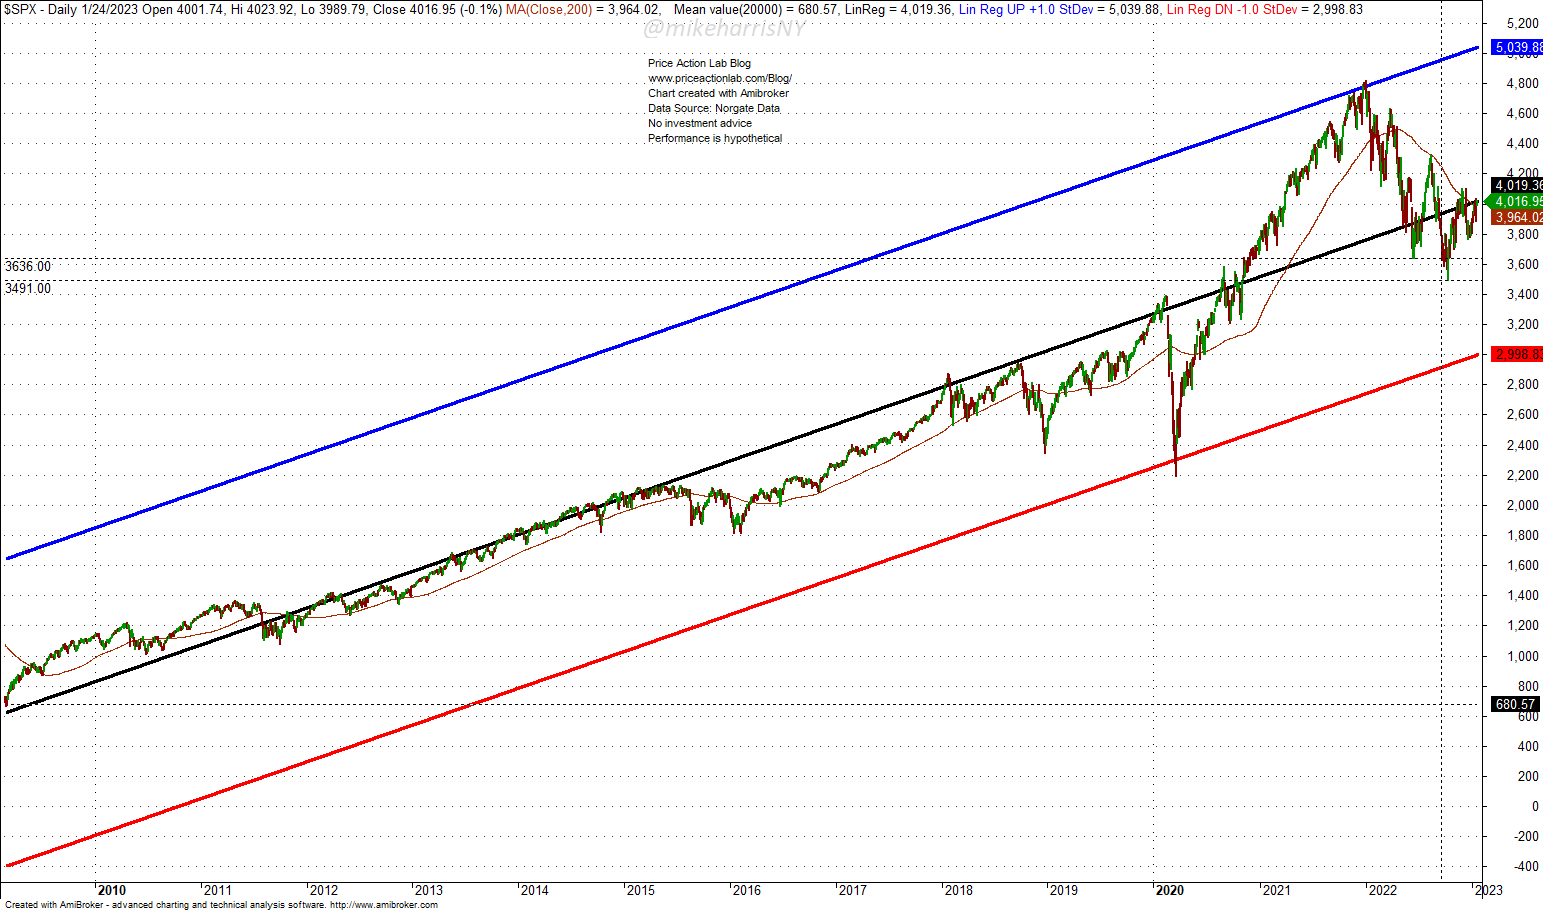
The last indicator of the original 7 is a linear regression chart of the S&P 500 since the GFC’s bottom and the start of QE, which caused the longest uptrend in stock market history. The chart shows the uptrend and the +1 and the -1 standard deviation lines.
S&P 500 Daily Chart with Linear Regression (Price Action Lab Blog – Norgate Data)
Excessive stimulus after the pandemic caused the index to reach the +1 standard deviation above the trend, which was an extreme move. Usually, extreme moves to the upside are followed by extreme moves to the downside. After the first article on the 7 indicators, the market made a low of about 4% lower, but there has not been a significant correction of the extreme +1 standard deviation move yet. Such a correction has high odds, although it is not necessary to happen.
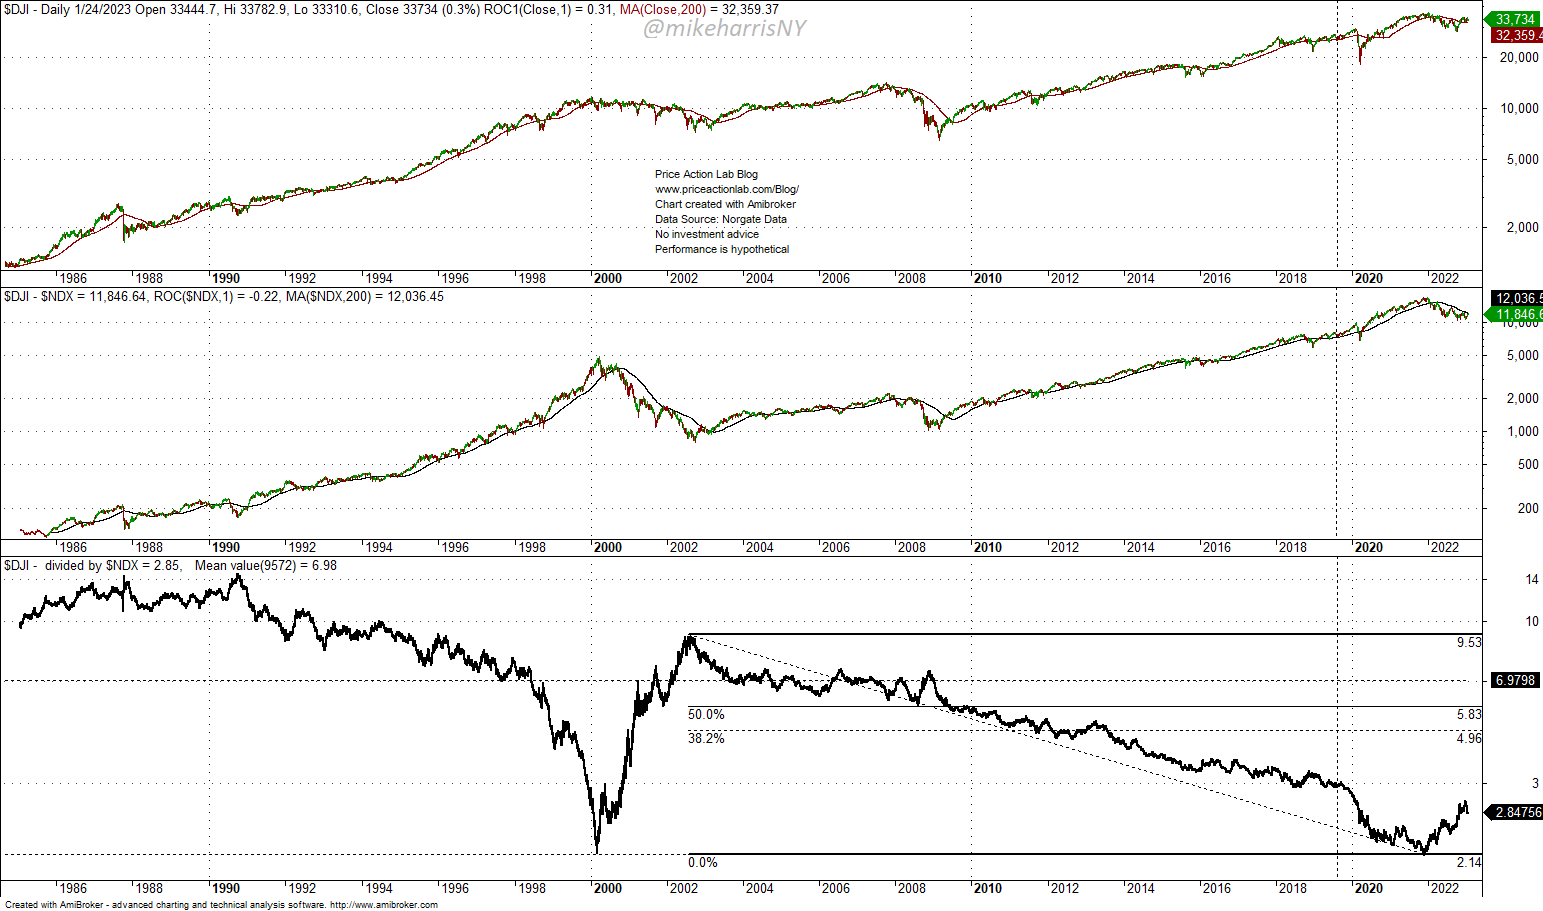
New indicator: Ratio of Dow Jones Industrial Average and Nasdaq-100
Ratio of Dow Jones Industrial Average and Nasdaq-100 (Price Action Lab Blog – Norgate Data)
Ratio charts are in most cases meaningless. We would have also marked this chart meaningless but the dot-com and 2022 tops occurred at the same low value. For this reason, we believe there may be higher signal-to-noise in this ratio chart. After the dot-com top, the ratio rebounded above its mean value of around 7 to around 9.5 by the bottom in 2002. The rebound after the top of 2022 has been slower and smaller in comparison. The rebound in the ratio could continue with accelerated losses in the tech sector of about 20% or more from current levels. This could bring the ratio around its 38.2% Fibonacci retracement level based on the 2002 top and 2022 bottom. In our opinion, this correction in the ratio is far from over. However, relative changes in the two indexes will matter for the final value reached.
Conclusion
When we try to answer the question as to whether the stock market has bottomed or there is more downside potential, in our opinion, technical indicators are more useful than fundamental, although there may be regime changes and biases.
We have looked at the updated values of 7 indicators from an SA article from September 23, 2022, and have concluded that a final bottom cannot be ruled out but the odds of continuation of the correction after a long period of consolidation are higher.
Specifically, although volatility has increased slightly near the bottom of the current relief rally, the signals are far from conclusive. In addition, most indicator values have not reached the extreme levels observed during previous major bottoms.